Threat Clustering is Hunters’ new methodology for threat-centric grouping, investigation, management, and analysis of alerts.
Up to 92% of all security alerts being triaged are redundant.
Ninety-two percent.
At Hunters, we are on a mission to empower security teams to focus on the incidents that matter and respond to them with full confidence, therefore our goal is to make the number of redundant alerts get as close as possible to zero.
Today, we are excited to announce a brand new capability in the Hunters SOC Platform to combat alert redundancy and repetitive work: Threat Clustering. This new capability reduces the time to triage and understand incidents, driving faster attack scoping and mitigation while reducing redundant work for noisy and similar signals. When implementing Threat Clustering in customer environments, time and time again we saw the number of alerts to handle shrink by an order of magnitude.

Threat-Focused, Not Alert-Focused
The ever-expanding security products stack means an ever-growing queue of signals and alerts that security analysts need to handle (don’t worry, I won’t go with the cliché of talking about alert fatigue at this point.)
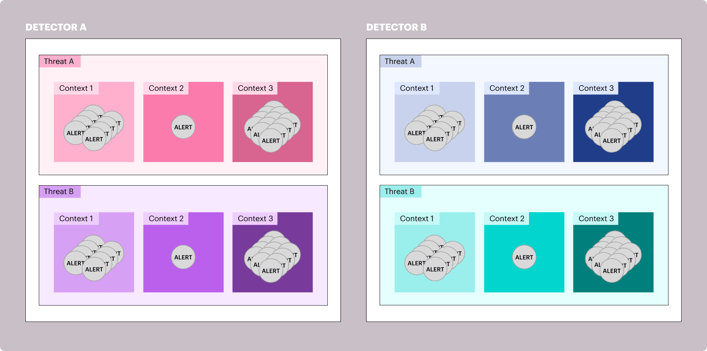
The analyst’s SOC platform should group all undesired behavior that is the result of the same threat, displaying all the different contexts in which the threat presented itself. In this way, the scope and context of the attack can be understood immediately.
In a recent case we saw with one of our customers, an identity provider alerted on nearly a million suspicious sign-in attempts, yet upon a closer look, all these attempts originated from a single IP - that's a single threat.
These attempts spanned across several users in the organization. These are the contexts.
You don’t have to chase a million signals separately. Structuring them intelligently makes it easy to see the entire threat, its exact scope, and precisely when this behavior started.
Another example from the most popular path for initial access, phishing alerts are a constant challenge for the SOC. Looking at a flat list of phishing alerts in a large enterprise can be a daunting task. So much so, that security teams are often incapable of monitoring them and are left just hoping that their security controls can hold the fort.
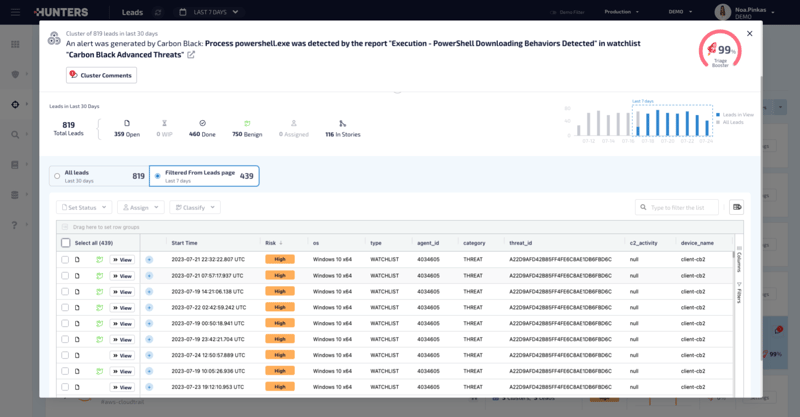
This specific cluster has consolidated 819 leads into one manageable cluster, improving triage time for this issue by 99%. Threat clustering boosts operational efficiency by reducing time spent on triage and investigation.
Of course, this pain isn’t really limited to true positives. Identifying the full scope of a true positive right off the bat is extremely powerful, but it's only half the story. It’s no secret that SOC teams spend at least half their time battling false positives.
That remote administration tool that the IT team used and blew up your alert queue? Once we cluster the alerts in a threat-centric way, it’s easy to quickly identify the exact red-team activity from the legitimate usage of an IT admin taking place on dozens of machines in the organization.
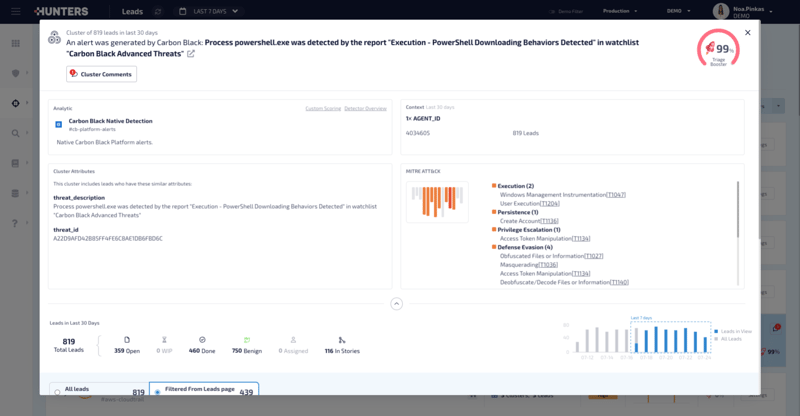
The Cluster Details Panel gives your team the full context of the cluster and allows for easy collaboration across any lead within the cluster.
What’s Under the Hood
In legacy systems such as SIEM, SOC analysts worked on a massive queue of alerts that were ordered by risk (at best). This is a greedy algorithm, and generally, greedy algorithms do not provide globally optimized solutions.
Clustering alerts by similarity is easier said than done: Understanding the underlying threat of each alert requires intimate familiarity with the different attack vectors and data sources.
We’ve experimented with different algorithms and methods to find the optimal clustering strategy for each scenario, allowing SOC teams to remain as efficient as possible.
Some cases are easy and intuitive, such as threat-intel IOCs, as the underlying threat in each of the alerts is the IOC value itself (domain, hash, or IP).
However, grouping by an exact value will get very limited results in scenarios such as suspicious process execution. Finding similarities between command-lines requires more advanced techniques and fuzzy logic.
Process command-lines will often include usernames/urls, which will vary for the same threat in different contexts. Yet these slight variations don’t change the threat represented in the alert, and should still be considered similar for investigation.
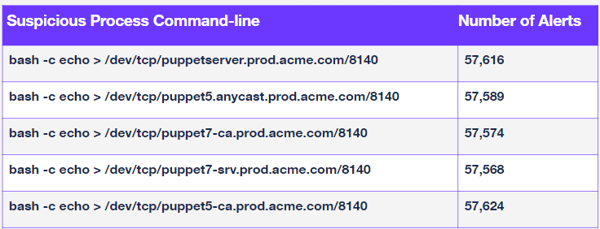
The above table contains numbers from a customer production environment which have been anonymized. While the command-line is slightly different, all of these alerts represent the same threat. Yet, some container security products can generate hundreds of thousands of alerts per month.
To make things even trickier, some processes like powershell.exe have endless capabilities and uses. Clustering all of them under a single threat will only make things more difficult for analysts.
These scenarios require a deeper investigation of the process tree and attributes to find meaningful similarities. However, a SOC analyst might not have the time or expertise to identify such repeating patterns.
Shifting the Paradigm: Less Triage, More Context
Security tools will give you thousands of alerts, but in reality these boil down to only a few threats. At scale, this becomes an enormous resource drain that Threat Clustering can minimize:
If it takes 20 minutes to triage a security alert, and the average cluster saves 50% of the redundant work, the efficiency boost for an average SOC would be 10 minutes per alert.
If a team of 5 people receives 1000 alerts per week, and they are able to triage them in 10 minutes each, the total time saved per week would be 139.5 hours. This is equivalent to more than three and a half 40-hour work weeks, which represents a significant amount of time that the team can use to focus on other important tasks and improving overall security.
Your SOC queue should look like the first page of Google: Most relevant findings at the top, redundant results omitted.